About the indicator "Waste generation"
By monitoring the total amount of generated waste, it is possible to evaluate the progress towards achieving the goal of avoiding and reducing the generation of waste, which ultimately contributes to more efficient use of resources. The indicator tracks the amount of produced waste according to economic activities (NACE).
Objective
• progress towards circular economy, separating the link between waste generation and economic growth, reducing total amount of waste generated
Description


The trend of increase in the total amount of generated waste at the EU level stops in 2020, in which there is a decrease in the amount generated by 8% compared to 2018, but in 2022 the amount increases again by 4% compared to 2020. In 2022, a total of 2133 million tons of waste, or 5 tons per capita, was generated in the EU-27.
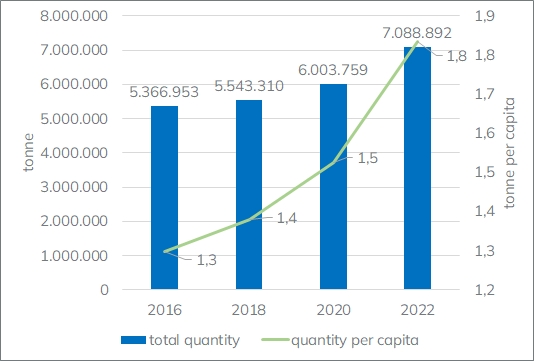
The trend of increasing the total amount of waste generated in the Republic of Croatia continues, and in 2022 the increase was 32% compared to 2016, and 18% compared to 2020. In 2022, the amount of generated waste amounted to 7,088,892 tons, or 1.8 tons per capita.
In the Republic of Croatia, the largest increase in the amount of waste generated in the observed period is related to the generation of secondary waste (156 %) during waste treatment operations, which is the result of the construction and commissioning of facilities for mechanical-biological treatment of mixed municipal waste. In the case of primary waste, the total increase was 28%, mostly related to mineral construction waste, waste metals, and waste paper.
In the total amount of waste generated in 2022, 2.5% was hazardous (180,042 tons) and 97.5% (6,908,850 tons) was non-hazardous waste.
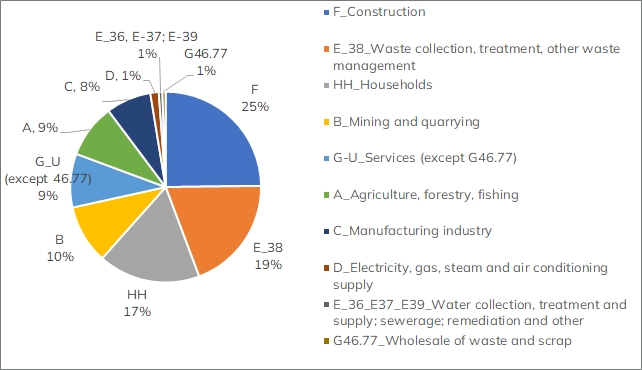
Considering generated waste with regard to its origin (economic activities and households), the construction sector (25%, 1,758,465 tons) had the largest share in the total amount of waste generated in 2022, followed by the waste management sector (19%, 1,381,864 tons), mining and extraction sector (10%, 706,402 t), agriculture, forestry and fishing sector (9 %, 646,525 t) and service sector (9%, 644,898 t). Shares of other economic activities are shown in Figure.
Households account for a share of 17% (1,225,456 tons) in total amount of generated waste. Household waste includes different types of waste produced by citizens, from municipal waste (e.g. mixed municipal waste, bulky waste, packaging waste, EE waste, etc.) to other types of waste such as e.g. scrap vehicles, scrap batteries, scrap tyres, etc.
When considering the types of waste generated in 2022, the most represented is mineral waste including construction waste, soil and stones (30.1%), household waste and similar waste such as mixed municipal waste, bulky waste, street cleaning waste, etc. (16.2 %), waste ferrous metals (14.3 %), animal feces, urine and manure (8.6 %), and paper and cardboard waste (6.7%).
Legal framework
- Regulations of the Republic of Croatia: Waste Management Plan of the Republic of Croatia for the period 2023 to 2028 (OG 84/2023); Waste Management Act (OG 84/2021, 143/2023); Ordinance on the Environmental Pollution Register (OG 3/2022); Ordinance on waste management (OG 106/2022).
- EU and international regulations: Directive 2008/98/EC on waste (Waste Framework Directive); Regulation (EC) 2150/2002 on waste statistics
Methodology
- Waste statistics (for hazardous and non-hazardous waste) are prepared in accordance with EUROSTAT's methodology prescribed by Regulation (EC) no. 2150/2002 on waste statistics. Waste statistics are compiled by statistical categories of waste defined by the same Regulation, and by economic activities (NACE) and households. Each statistical category of waste is divided into hazardous and non-hazardous waste.
- Waste statistics are prepared on the basis of data collected in the Waste Management Information System, mostly reported in the Environmental Pollution Register (ROO) by waste code (in accordance with the Waste Catalog from the Ordinance on Waste Management, which is harmonized with European List of Waste) and by recovery R /disposal D operations (Appendix I and II of the Law on waste management). For waste from certain economic activities (such as construction sector), quantities are determined by combining other methods (estimation).
Sources
- Ministry of Environmental Protection and Green Transition (MZOZT)
Data collection
- Production of statistics - biannual
Documents
Ministry of Environmental Protection and Green Transition
o Waste statistics - data sets
• EUROSTAT:
Updated: 5 Feb 2025